Vista de análisis
Descripción
The "Analysis view" can be launched from the raster toolbar by selecting "Raster layer" from the left drop-down button and "Analysis View" on the drop-down button on the right. Make sure that the name of the raster layer that you want to analyze is displayed as current layer in the text box.

Analysis View icon
With this functionality you can zoom in on the current raster layer with 3 different zoom levels:
- On the left of the view, the layer is added to the locator map of gvSIG. This provides a general view of the layer, and you can zoom into the locator map by clicking and dragging, thus drawing a red rectangle. The area inside the red rectangle will be displayed in the view.
- The view itself is the second zoom level which functions independently, and the zoom variations that are performed on the view will be applied to the locator map as well so that it keeps being centered on the correct area.
- When launching the Analysis view, a small floating window labelled "Cursor Zoom" appears in the upper right corner of gvSIG. This window has the highest zoom level. The zoom level is fixed and always centered on the mouse point. By moving the mouse over the gvSIG view, you will see the contents change.
You can change the relation between the zoom level of this floating window and the gvSIG view. This is done by right-clicking on the floating window and selecting one of the values that are shown in the drop-down menu that appears. The available options are x4, x8, x16, and x32. This means that the pixels in the floating window will be 4, 8, 16, or 32 times bigger than the original.
The floating window also shows the RGB values of the pixel on which the cursor is currently located. The text colour of the RGB values as well as the colour of the central cross (red by default) can be changed by right-clicking on the floating window and choosing the option from the drop-down menu.
Keep in mind that, to see the effects in the floating window while moving the mouse over the view, the view must be active. If it is not active, just click on the view. When the cursor is outside the view, the content of the floating window appears black.
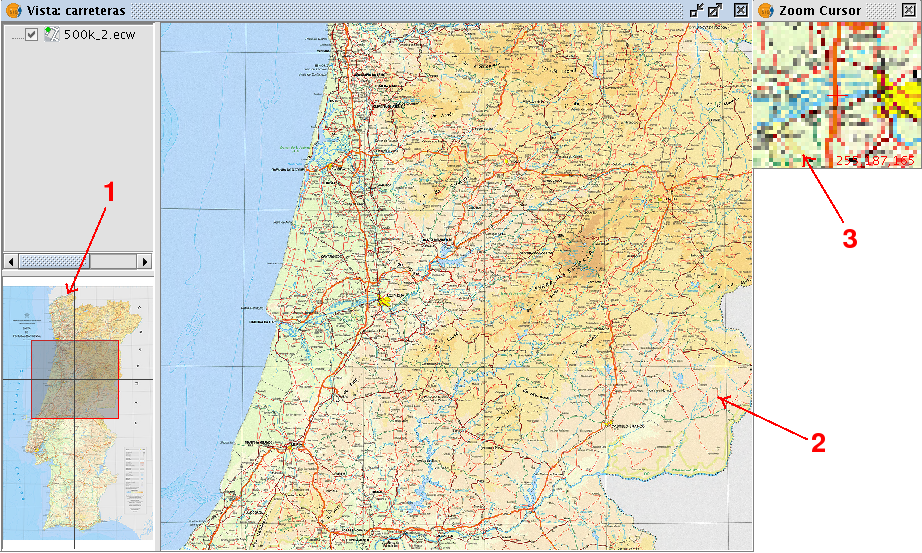
Screenshot with the different elements of Analysis View
There can only be one Analysis view open at any time in gvSIG. Therefore, the button "Analysis View" is re-labelled as "Close Analysis View" when the Analysis view is already open, so that it can be closed before re-opening.
